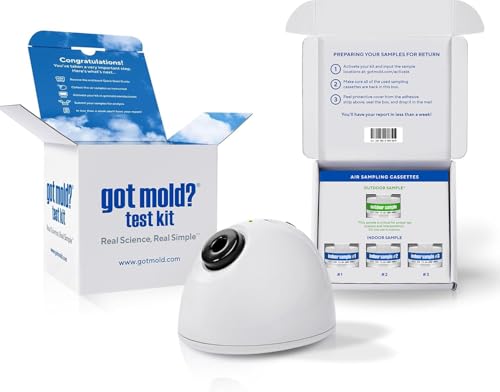
An ERMI report gives you a standardized, DNA-based picture of the mold burden inside a home. Understanding how to read an ERMI report is not always straightforward, the numbers, group labels, and score thresholds can be confusing without context. This guide walks you through every section of a real-style report so you can interpret your own results with confidence and know what steps to take next.
What Is an ERMI Test?
ERMI stands for Environmental Relative Moldiness Index. It was developed by the U.S. Environmental Protection Agency as a research tool to assess the mold burden in homes and its relationship to respiratory illness in children. The test uses quantitative PCR (qPCR), a DNA-based method, to detect and measure 36 specific mold species from a dust sample, typically collected with a Swiffer-style electrostatic cloth or vacuum cassette.
The 36 species are divided into two groups:
- Group 1 (26 species): Water-damage-associated molds that are rarely found in normal, dry buildings.
- Group 2 (10 species): Common indoor molds found in most homes regardless of water damage history.
The final ERMI score is calculated as the sum of the log-transformed Group 1 values minus the sum of the log-transformed Group 2 values. A higher ERMI score indicates greater relative moldiness. You can read more about the EPA’s original ERMI research at the EPA’s Indoor Air Quality: Mold and Dampness page.
How to Read the Results Table
The core of your report is a two-part table listing each species, its measured level, and an asterisk rating. Here is what each column means:
SE/mg (Spore Equivalents per Milligram)
This is the raw DNA-based count of each mold species, expressed as spore equivalents per milligram of dust. It reflects how many fungal DNA copies were detected and normalized to the weight of the dust sample. A higher number means more of that species was present in the collected dust.
Some species will show “ND” (None Detected), which simply means no DNA for that species was found in the sample.
The Star (Asterisk) Rating
The asterisks compare each species’ level to the geometric mean from a 2007 national survey of U.S. homes. They indicate how many times higher than average a given reading is:
| Symbol | Meaning |
|---|---|
| * | 10 times higher than the national average for that species |
| ** | 100 times higher than the national average |
| *** | 1,000 times higher than the national average |
A triple-asterisk result for a Group 1 (water-damage) mold is a significant finding. It does not by itself confirm visible mold growth, but it strongly suggests that moisture-associated fungal amplification has occurred somewhere in the building envelope.
Quartile (Q) Column
Some ERMI Plus reports include a quartile column for each species. Quartiles rank the detected level for that individual species against the national distribution of homes. A quartile 4 (Q4) result means the level falls in the top 25% of all homes sampled, the highest range. Quartile 1 (Q1) means the level is in the lowest 25%.
Understanding the ERMI Score
The final ERMI score is the single most important number on the report. It is calculated as:
ERMI Score = Sum of logs (Group 1) minus Sum of logs (Group 2)
The score can range from roughly -10 to +20 or higher. The interpretation table included in standard reports breaks results into four quartile bands:
| Quartile | ERMI Score Range | General Interpretation |
|---|---|---|
| Q1 (Low) | Less than -4 | Low relative moldiness; further investigation generally not needed |
| Q2 (Low-Medium) | -4 to less than 0 | Further investigation may be warranted if occupants have been reactive or sensitized |
| Q3 (Medium-High) | 0 to less than 5 | Elevated mold burden; investigation recommended |
| Q4 (High) | 5 and above | High relative moldiness; professional assessment strongly recommended |
An important note for people dealing with Chronic Inflammatory Response Syndrome (CIRS): the general population quartile cutoffs above are not the same as the clinical threshold used by many practitioners. According to the lab commentary in standard ERMI reports, for individuals with CIRS, an ERMI score of 2 or less is often considered a safe environment. If you or a family member has been diagnosed with CIRS, consult with both your treating physician and a certified Indoor Environmental Professional (IEP) before drawing conclusions from the quartile table alone.
Example ERMI Report Walkthrough (Fictional)
The following is a fictional, clearly-labeled example based on typical report structures. No real names, addresses, or identifiers are used.
| Field | Example Value |
|---|---|
| Sample Type | Swiffer (electrostatic dust cloth) |
| Sample Location | All interior rooms, composite |
| Status | Pre-Remediation |
| Sum of logs Group 1 | 36.3 |
| Sum of logs Group 2 | 15.6 |
| ERMI Score | 20.7 |
An ERMI score of 20.7 falls well into Quartile 4 and is substantially above the CIRS threshold of 2. In this fictional scenario, the standout Group 1 findings include high SE/mg readings for species like Aspergillus versicolor, Cladosporium sphaerospermum, and Aspergillus sydowii, each rated at Q4 in the national distribution. Several are 1,000 times above the national geometric mean (triple asterisk).
Compare that to a fictional post-remediation report for the same property:
| Field | Post-Remediation Value |
|---|---|
| Sum of logs Group 1 | 32.5 |
| Sum of logs Group 2 | 15.9 |
| ERMI Score | 16.6 |
The score dropped from 20.7 to 16.6 after remediation, a meaningful improvement, but still in Q4 and well above the CIRS-safe threshold. This illustrates an important point: a lower post-remediation score does not automatically mean the building is safe for sensitive occupants. The score needs to reach an appropriate target, not just improve.
Key Species to Watch in Group 1
Not all Group 1 molds carry the same level of concern. These are some of the species that warrant particular attention when they appear at elevated levels:
- Stachybotrys chartarum: Requires very wet, cellulose-containing materials to grow. Any detected level in a composite dust sample is notable because it is rarely present in dry homes.
- Chaetomium globosum: Another indicator of sustained moisture on cellulose; commonly found on drywall paper after water intrusion.
- Aspergillus versicolor: One of the most frequently flagged species in ERMI reports from water-damaged buildings. It produces sterigmatocystin, a mycotoxin of concern.
- Aspergillus niger: A common environmental mold that can amplify significantly under high-humidity conditions indoors (above roughly 70% relative humidity).
- Wallemia sebi: Thrives at lower water activity than most other molds, making it a marker for moderate, long-term humidity issues rather than acute flooding.
For a deeper look at common water-damage species, visit our guide on mold testing methods and what they measure.
Limitations of the ERMI Test
The ERMI is a useful screening tool, but it has real limitations you should understand before making decisions based solely on the score:
- It is a composite measure. A whole-home Swiffer sample averages dust from every room. It cannot tell you which room has the problem or whether growth is active or dormant.
- It reflects historical dust accumulation. Settled dust can contain mold DNA from months or years ago. A high score after visible mold is remediated does not always mean current active growth.
- Sample collection technique matters. An improperly collected sample, one that only skims a small area or a recently cleaned floor, may underrepresent true conditions.
- It was developed for U.S. homes. The national geometric means used to calculate the score are based on a 2007 U.S. survey. Applying the same score thresholds to homes in other climates or countries involves some extrapolation.
- It does not measure mycotoxins. A high ERMI confirms elevated mold DNA but does not confirm mycotoxin presence. Separate testing is required for that assessment.
Learn more about pairing ERMI with other assessments in our overview of professional mold remediation standards and what to expect from a full inspection.
What to Do After Getting Your Results
Your next steps depend on your score, the specific species flagged, and your household’s health situation:
- Score below 0 (Q1-Q2), no sensitive occupants: Results are reassuring. Maintain indoor humidity below 50% and address any known moisture sources as a precaution.
- Score of 0 to 5 (Q3), no current symptoms: Schedule a walkthrough inspection with a certified mold inspector to identify potential moisture sources. Review your air quality testing options for follow-up.
- Score above 5 (Q4) or any score with symptomatic occupants: Consult a certified Industrial Hygienist or IEP to identify the source of water intrusion and mold amplification. Do not attempt large-scale remediation (generally defined as areas greater than 10 square feet) without professional guidance.
- Any score for CIRS patients or highly sensitized individuals: Discuss results with your treating physician before re-occupying. A score above 2 may not be acceptable depending on your clinical situation.
For guidance on finding qualified professionals, see our resource on what to look for when hiring a mold inspector.
Frequently Asked Questions
What is a good ERMI score for a healthy home?
For the general population, an ERMI score below -4 (Quartile 1) is considered low moldiness and generally does not require further investigation. Scores from -4 to just below 0 (Quartile 2) are low-to-medium and may warrant review if occupants have allergy or respiratory sensitivity. For individuals with CIRS or significant mold-related illness, many practitioners use a stricter threshold of 2 or below as the target for a safe environment. Always confirm the right target with your doctor and a certified Indoor Environmental Professional.
What is the difference between a pre-remediation and post-remediation ERMI?
A pre-remediation ERMI establishes a baseline of the mold burden before any cleanup work begins. A post-remediation ERMI, collected after the work is complete and the area is cleared, tests whether the mold burden has been reduced to an acceptable level. Post-remediation testing should ideally be done by an independent party, not the same company that performed the remediation, to avoid a conflict of interest. A significant drop in score is a positive sign, but the score should meet the target threshold appropriate for the building’s occupants, not simply be lower than before.
Can I collect my own ERMI sample?
Yes. Most ERMI labs provide a collection kit that includes a Swiffer-style cloth or vacuum cassette along with chain-of-custody paperwork and instructions. Proper technique requires following the specific collection protocol for your lab, typically wiping a defined floor area across multiple rooms. Self-collection is common and acceptable for screening purposes. However, if you are collecting samples for legal, insurance, or medical documentation purposes, having a certified professional collect the sample protects the integrity of the results.
How long does it take to get ERMI results back?
Turnaround times vary by laboratory, but most standard qPCR-based ERMI reports are completed within 5 to 10 business days after the lab receives the sample. Rush processing is often available for an additional fee, sometimes cutting the timeline to 2 to 3 business days. Factor in shipping time when planning around a real estate transaction, remediation clearance, or medical appointment.
Does a high ERMI score mean I have a mold problem in my walls?
A high ERMI score indicates elevated levels of water-damage-associated mold DNA in settled house dust. It strongly suggests that mold amplification has occurred somewhere in the building, but it cannot pinpoint the location or confirm that growth is active and ongoing. A follow-up investigation by a certified inspector, using visual assessment, moisture meters, infrared thermal imaging, and possibly targeted air or surface sampling, is needed to identify where the mold is growing. A high score alone is a reason to investigate further, not to immediately tear open walls without a systematic inspection first. See our article on how to find hidden mold in your home for guidance on that process.
These statements have not been evaluated by the Food and Drug Administration. This information is not intended to diagnose, treat, cure, or prevent any disease. Content is for informational purposes only and is not medical advice; consult a qualified healthcare provider before starting any supplement. As an Amazon Associate we earn from qualifying purchases.