Understanding how to read mold test results is one of the most important skills a homeowner can develop after ordering an air quality test or surface sample. Lab reports arrive packed with Latin species names, spore counts measured in CFU/m3 or spores per cubic meter, indoor-to-outdoor comparison ratios, and technical terminology that can feel overwhelming without context. The difference between interpreting these numbers correctly and misreading them can mean the difference between unnecessary panic over normal background mold levels and missing a genuinely dangerous contamination event that requires professional remediation. This guide breaks down every section of a typical mold lab report, explains what the numbers actually mean, and provides clear action thresholds so that any homeowner can look at a set of results and make an informed decision about next steps.
Mold testing laboratories such as EMSL Analytical, EMLab P&K, and Eurofins process hundreds of thousands of samples annually. Each lab follows standardized analytical methods, but the reports they generate can vary significantly in layout and terminology. Whether the test was a DIY home mold test kit or a sample collected by a certified mold inspector, the core data points remain the same: species identification, concentration levels, and a comparison framework for determining whether the results indicate a problem. Learning to navigate these data points transforms a confusing document into a practical decision-making tool.
Our reviews are based on aggregated verified buyer feedback, manufacturer specifications, ingredient analysis, and published expert opinion. Products are not independently purchased or tested by our team. We may earn a commission if you purchase through our links, at no extra cost to you. How We Review
[table-of-contents]
Types of Mold Tests and How They Affect Your Results
Before diving into the numbers on a lab report, understanding which type of test was performed is essential because the testing method determines how results are expressed and what comparison framework applies. Each method captures different information, and the interpretation criteria differ significantly between them. The three primary mold testing methods used in residential settings are air sampling (spore trap analysis), surface sampling (tape lift, swab, or bulk), and dust sampling (ERMI and MSQPCR).
Air Sampling (Spore Trap Analysis)
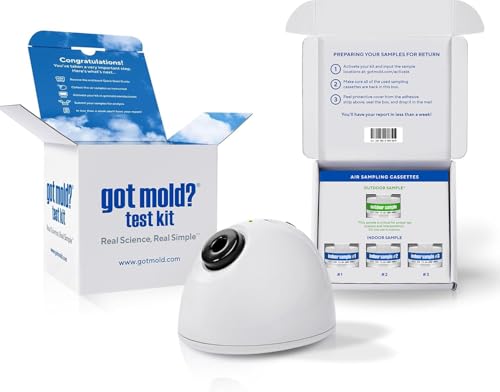
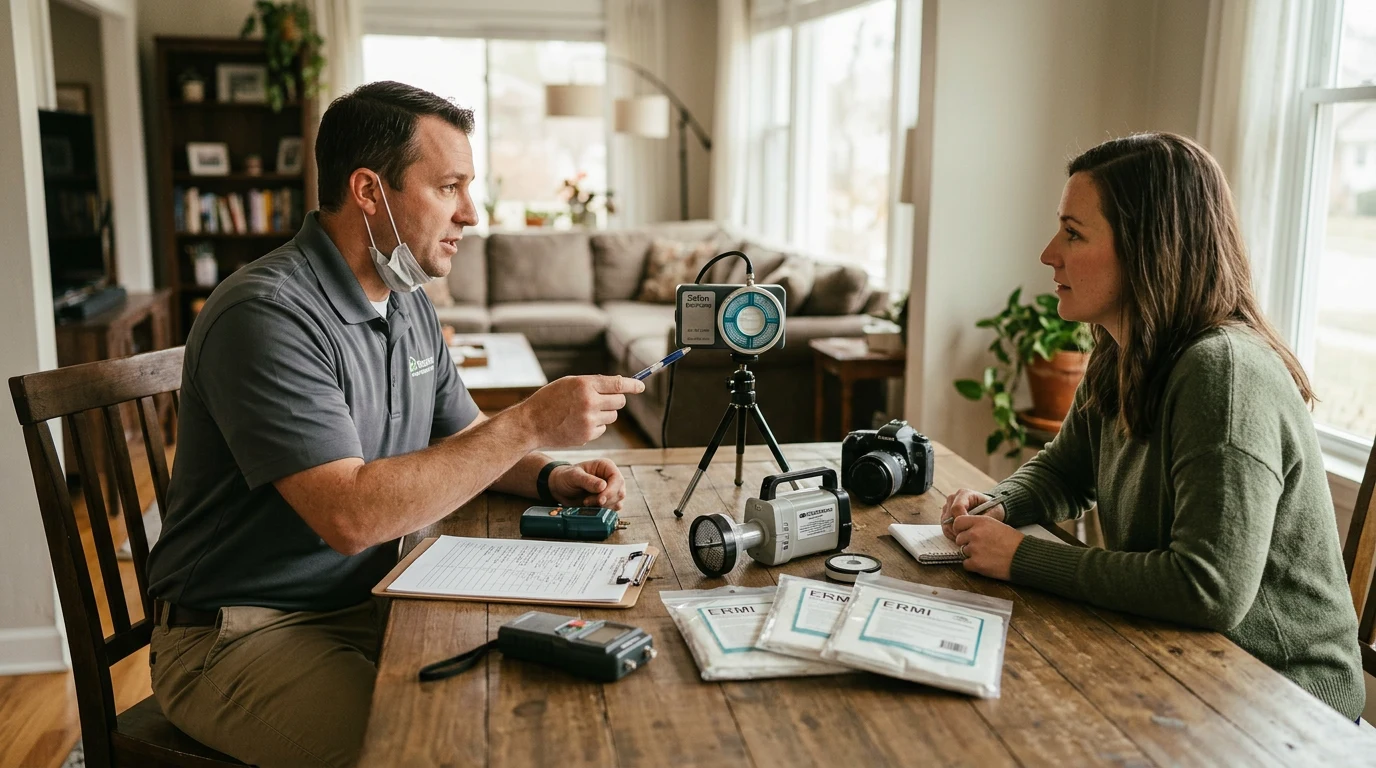
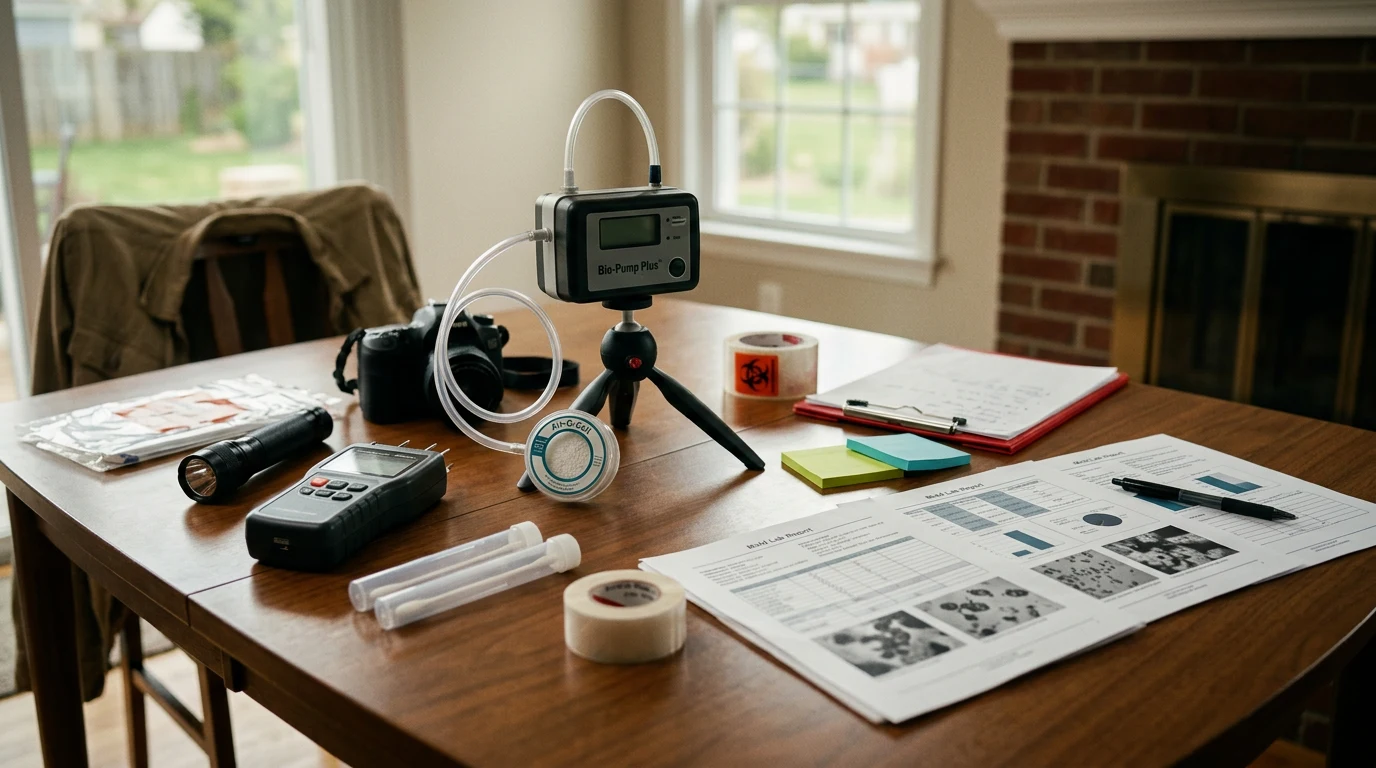
Air sampling is the most common method used by professional mold inspectors and many DIY mold test kits. A calibrated air pump draws a known volume of air (typically 75 liters over 5 minutes at 15 liters per minute) across a sticky collection medium inside a cassette. The spores that impact the surface are then counted and identified under a microscope by a trained analyst. Results are reported as spores per cubic meter of air (spores/m3), sometimes written as counts/m3. A proper air sampling protocol requires at minimum one outdoor (control) sample and one indoor sample from each area of concern. Without the outdoor baseline, the indoor numbers are almost meaningless because mold spores are always present in outdoor air, and some of that outdoor air enters every building.
When using a quality air sampling test kit, following the manufacturer instructions for pump calibration and sample duration is critical. Running the pump for too short a period undersamples the air, while running too long can overload the collection surface, making accurate counting impossible. Most AIHA-accredited laboratories reject overloaded samples and request resampling.
Surface Sampling (Tape Lift, Swab, and Bulk)
Surface samples identify exactly which mold species are growing on a specific material. Tape lift samples use clear adhesive tape pressed against the suspect surface to collect spores and hyphal fragments. Swab samples use a sterile cotton or foam swab moistened with a transport medium. Bulk samples involve cutting away a small piece of the contaminated material (drywall, carpet, wood) and sending the entire piece to the lab. Surface sample results are reported differently than air samples. Tape lifts are typically reported as a semi-quantitative scale (rare, low, medium, high) along with species identification. Swab and bulk samples may report in colony-forming units per area (CFU/cm2) if cultured, or in a descriptive format if analyzed by direct microscopy.
ERMI and MSQPCR Dust Sampling
The Environmental Relative Moldiness Index (ERMI) was developed by the EPA and uses DNA-based analysis (MSQPCR, or Mold Specific Quantitative Polymerase Chain Reaction) to identify and quantify 36 specific mold species from a dust sample. Results are expressed as an ERMI score, a single number that typically ranges from negative 10 to positive 20 or higher. The ERMI score represents the difference between the sum of concentrations of 26 Group 1 molds (water-damage indicator species) and 10 Group 2 molds (common outdoor species). An ERMI test kit provides a more comprehensive species analysis than standard air sampling but represents accumulated mold exposure over time rather than current airborne concentrations. The EPA developed the ERMI scale using data from the 2006 HUD American Healthy Homes Survey.
Anatomy of a Mold Lab Report
A standard mold lab report from an AIHA-accredited laboratory contains several distinct sections. Understanding each section and how they relate to one another is the key to reading mold test results accurately. Most reports follow a similar structure regardless of the laboratory, though the layout and specific terminology may vary.
Report Header and Sample Information
The header section identifies the laboratory (EMSL, EMLab P&K, Eurofins, Pro-Lab, etc.), the report date, and a unique report or project number. Below that, the sample information section lists each sample with its collection date, sample type (spore trap, tape lift, swab, bulk), the location where it was collected (outdoor, bedroom, basement, bathroom), the volume of air sampled (for air samples), and the analytical method used. The analytical method is important because it determines what the lab can and cannot identify. Direct examination (non-cultured) analysis counts and categorizes spores based on their physical appearance under a microscope. Cultured analysis grows the collected organisms on nutrient media, allowing more precise species-level identification but taking 7 to 14 days longer. Some mold genera (like Aspergillus and Penicillium) look nearly identical under direct microscopy, which is why reports often group them as “Aspergillus/Penicillium” or “Asp/Pen” when direct examination is used.
The Results Table: Species and Concentrations
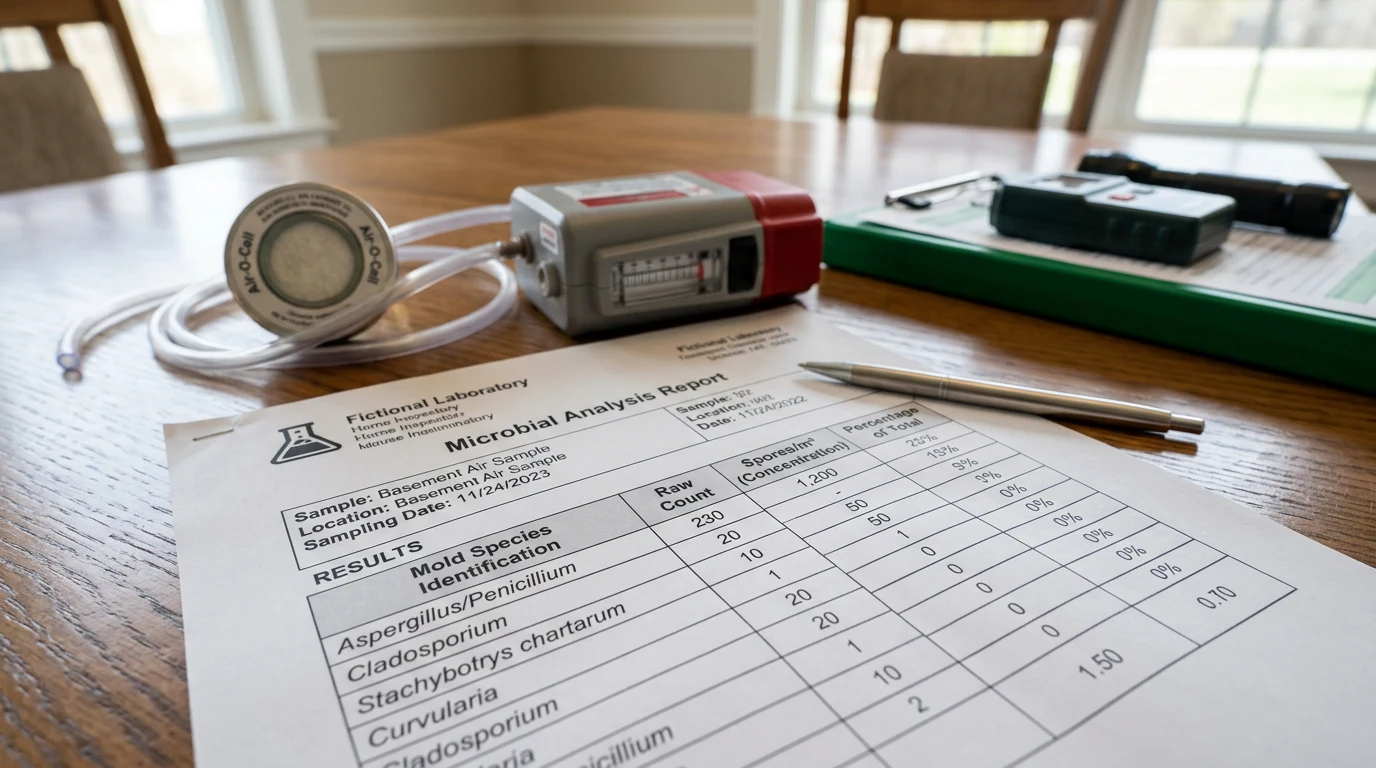
The core of any mold report is the results table. For air samples analyzed by direct examination, this table lists each identified mold genus or type in the left column, the raw count (number of spores observed on the sample trace), the concentration calculated as spores per cubic meter (spores/m3), and often a percentage of the total spore count. The concentration is calculated by dividing the raw count by the volume of air sampled and applying any correction factors specific to the sampling cassette. For example, if 150 Cladosporium spores are counted on a sample where 75 liters of air were collected, the concentration would be reported as 2,000 spores/m3 (150 divided by 0.075 cubic meters). Labs also report a minimum detection limit, which represents the lowest concentration that can be reliably detected. For a standard 75-liter air sample, this is typically 13 spores/m3.
For cultured air samples (using Andersen impactors or similar), results are reported in colony-forming units per cubic meter (CFU/m3). Each colony that grows on the culture plate represents at least one viable organism, so CFU/m3 counts tend to be lower than spore trap counts because spore traps also capture dead spores, fragments, and non-viable material that would not grow in culture.
The Outdoor Control Sample
The outdoor control sample is arguably the most important data point on the entire report. Mold spores exist everywhere in the outdoor environment. A summer outdoor sample in the Midwest might show 10,000 to 30,000 total spores/m3, while a winter sample in the same location might show 500 to 2,000 spores/m3. Seasonal variation is enormous. Without knowing what is “normal” in the outdoor air on the day of sampling, indoor numbers lack context. The outdoor sample establishes the baseline against which every indoor sample is compared. Any indoor mold species that appears at a significantly higher concentration than the outdoor sample, or any species found indoors that is absent from the outdoor sample, is a potential indicator of an indoor mold source.
How to Interpret Spore Count Numbers
No federal agency, including the EPA, has established specific numerical thresholds that define “safe” or “unsafe” mold spore levels. The EPA’s official position is that mold testing is not required before remediation if visible mold is present, and that no EPA-approved standards exist for acceptable mold concentrations in indoor air. Despite this, the mold testing industry and experienced industrial hygienists have developed widely accepted interpretation guidelines based on decades of sampling data. These guidelines focus on the relationship between indoor and outdoor samples rather than absolute numbers.
The Indoor-to-Outdoor Ratio Method
The primary method for interpreting air sample results compares the total indoor spore count and the species profile to the outdoor control. In a building without mold problems, indoor total spore counts should be lower than outdoor total spore counts (because the building envelope filters out some spores), and the species distribution indoors should roughly mirror the outdoor profile. The general interpretation framework used by most industrial hygienists follows these principles:
- Indoor total count lower than outdoor, similar species: Normal conditions. The building is functioning as expected, filtering outdoor spores and not generating additional indoor spores.
- Indoor total count roughly equal to outdoor, similar species: Generally acceptable but may indicate excessive ventilation or poor filtration. Not typically a cause for concern.
- Indoor total count higher than outdoor for any single species: Potential indicator of an indoor source for that specific mold type. Warrants further investigation, especially if the elevated species is a water-damage indicator.
- Indoor species present that are absent from outdoor sample: Strong indicator of an indoor growth source. This is one of the clearest red flags on a mold report.
- Indoor total count significantly higher than outdoor (2x or more): Strong indicator of indoor mold contamination requiring professional assessment and likely remediation.
Example Mold Test Result Interpretation Table
The following table demonstrates how a trained analyst or homeowner would interpret a typical residential mold air sampling report. This example uses a three-sample set: one outdoor control and two indoor locations.
| Mold Species | Outdoor Control (spores/m3) | Living Room (spores/m3) | Basement (spores/m3) | Interpretation |
|---|---|---|---|---|
| Cladosporium | 3,200 | 1,600 | 1,900 | Normal: indoor levels below outdoor for both locations |
| Aspergillus/Penicillium | 1,800 | 800 | 6,400 | Basement elevated 3.5x outdoor: likely indoor Asp/Pen source in basement |
| Stachybotrys | 0 | 0 | 160 | Absent outdoors, present indoors: strong indicator of active water damage in basement |
| Chaetomium | 0 | 0 | 80 | Absent outdoors, present indoors: another water-damage indicator species |
| Basidiospores | 2,400 | 1,100 | 1,300 | Normal: common outdoor spores at expected indoor levels |
| Curvularia | 400 | 130 | 170 | Normal: outdoor species at lower indoor concentrations |
| Total Count | 7,800 | 3,630 | 10,010 | Living room normal. Basement 28% higher than outdoor total: elevated |
In this example, the living room results are textbook normal. Every species is present at concentrations below the outdoor baseline, and no unusual species appear. The basement tells a completely different story. The Aspergillus/Penicillium group is elevated 3.5 times above outdoor levels, and two species that were not detected outdoors at all (Stachybotrys and Chaetomium) appear in the basement sample. Both Stachybotrys chartarum and Chaetomium are classified as water-damage indicator species, meaning they require sustained moisture to grow. Their presence indoors when absent outdoors is a reliable marker that an active or recent water intrusion event has occurred in that space.
Key Mold Species and What They Indicate
Species identification is the most actionable information on a mold test report. Different mold species require different environmental conditions to thrive, and their presence (or absence) reveals what is happening in the building. Understanding the significance of the most commonly reported species helps transform raw data into practical knowledge. A properly collected mold test sample can identify dozens of species, but several carry particular weight in residential assessments.
Stachybotrys chartarum (Black Mold)
Stachybotrys chartarum is the species most commonly associated with the term “black mold” and generates the most concern among homeowners. It requires chronically wet cellulose materials (drywall paper, ceiling tiles, cardboard, wallpaper) to grow, meaning its presence indicates a sustained water problem, not a brief humidity spike. Stachybotrys spores are heavy and sticky, so they do not easily become airborne compared to lighter species like Cladosporium or Aspergillus. When Stachybotrys appears on an air sample, even at low concentrations, it strongly suggests active growth somewhere in the building because its spores do not travel far from the source colony. Any detection of Stachybotrys indoors when it is not present in the outdoor control sample warrants professional remediation assessment. This species is also associated with the production of satratoxins and other mycotoxins that pose health concerns.
Aspergillus and Penicillium
Aspergillus and Penicillium are grouped together on direct examination (non-cultured) reports because their spores are morphologically similar under a microscope. Both genera contain hundreds of species, many of which are common in both indoor and outdoor environments. Their presence on an air sample is expected. The critical factor is concentration relative to the outdoor sample. Indoor Aspergillus/Penicillium levels that exceed the outdoor baseline by more than double suggest an indoor amplification source. Elevated Aspergillus/Penicillium indoors is the single most common finding on problematic mold reports. These genera can grow on a wide variety of substrates and at lower moisture levels than Stachybotrys, making them faster colonizers. Some Aspergillus species (A. fumigatus, A. niger, A. flavus) are considered medically significant and can cause aspergillosis in immunocompromised individuals.
Cladosporium
Cladosporium is typically the most abundant mold genus in outdoor air and frequently the dominant species on both indoor and outdoor samples. It is a common leaf surface mold and thrives in temperate climates. Seeing Cladosporium at high concentrations on an outdoor sample (5,000 to 20,000+ spores/m3 in summer months) is completely normal. Indoor Cladosporium levels should track below the outdoor levels. If indoor Cladosporium significantly exceeds the outdoor concentration, it may indicate an indoor source such as growth on damp window sills, HVAC components, or bathroom surfaces. However, in most assessments, Cladosporium is not considered a high-concern finding unless the elevation is dramatic or occupants are specifically sensitized to this genus.
Chaetomium
Chaetomium is a strong water-damage indicator species that grows on chronically wet cellulose materials, very similar to Stachybotrys in its habitat requirements. It frequently co-occurs with Stachybotrys on water-damaged drywall. Chaetomium produces large, distinctive ascospores that are easy for laboratory analysts to identify. Like Stachybotrys, any indoor detection of Chaetomium when it is absent from the outdoor sample is a significant finding that indicates an active or recent water damage event. This species also produces chaetoglobosins, a class of mycotoxins with documented cytotoxic properties.
Other Common Report Species
Alternaria is an outdoor-dominant genus commonly associated with plant debris and soil. Indoor levels should be well below outdoor concentrations. Basidiospores come from mushrooms, bracket fungi, and other Basidiomycete organisms and are extremely common in outdoor air. Elevated indoor basidiospores can indicate wood decay fungi growing on structural lumber. Epicoccum, Curvularia, and Nigrospora are primarily outdoor molds that are occasionally reported on indoor samples at low levels. Fusarium is a soil-dwelling genus that can indicate water intrusion from exterior sources. Trichoderma is another water-damage indicator that degrades cellulose and frequently colonizes wet drywall alongside Stachybotrys and Chaetomium.
Understanding ERMI Scores
The ERMI scoring system uses a different framework than standard air sampling. Because the ERMI is based on DNA analysis of settled dust, it reflects accumulated mold exposure over weeks or months rather than a snapshot of airborne conditions. The EPA categorized the ERMI scale into quartiles based on the national dataset from the HUD American Healthy Homes Survey.
| ERMI Score Range | EPA Quartile | Interpretation | Recommended Action |
|---|---|---|---|
| Below -4 | Q1 (Lowest 25%) | Very low moldiness relative to national average | No action needed. Building has excellent mold control. |
| -4 to 0 | Q2 | Low moldiness, below national average | No action needed. Typical of well-maintained buildings. |
| 0 to 5 | Q3 | Moderate moldiness, above national average | Investigate moisture sources. Consider professional inspection if health symptoms present. |
| Above 5 | Q4 (Highest 25%) | High moldiness relative to national average | Professional mold inspection recommended. Likely active water damage or hidden mold growth. |
Beyond the overall ERMI score, the individual species data in an ERMI report reveals valuable information. The 26 Group 1 species are water-damage indicators. If the ERMI score is elevated primarily because of high Group 1 species (like Stachybotrys, Chaetomium, or Aspergillus versicolor), that provides strong evidence of a moisture problem. If the score is elevated due to Group 2 species (like Cladosporium cladosporioides or Epicoccum nigrum), the building may simply have high outdoor mold infiltration rather than an internal growth problem.
Common Mistakes When Reading Mold Test Results
Misinterpreting mold test results is remarkably common, and the consequences range from wasting thousands of dollars on unnecessary remediation to ignoring a genuine contamination event. Several patterns of misinterpretation appear repeatedly.
Focusing on Absolute Numbers Instead of Ratios
The most frequent mistake is looking at a total indoor spore count of, say, 5,000 spores/m3 and concluding the building has a mold problem based solely on that number. Without context from the outdoor sample, that number is meaningless. If the outdoor count on the same day was 15,000 spores/m3, then 5,000 indoors represents excellent filtration and no indoor mold source. Conversely, an indoor count of just 800 spores/m3 might look low in absolute terms, but if 600 of those spores are Stachybotrys and the outdoor sample shows zero Stachybotrys, the building has a serious problem. Always evaluate indoor results in the context of the outdoor control sample and analyze species individually, not just total counts.
Ignoring Species Identification
Some homeowners look only at the total spore count and ignore which species make up that total. A total count of 4,000 spores/m3 composed entirely of Cladosporium and Basidiospores (common outdoor types) tells a completely different story than 4,000 spores/m3 with 2,000 of that being Aspergillus/Penicillium elevated above outdoor levels. Species composition is more diagnostically useful than total count in most assessments.
Treating a Single Sample as Definitive
Air sampling captures a snapshot of airborne conditions during a 5-minute window. Spore concentrations fluctuate throughout the day based on HVAC operation, occupant activity, wind patterns, temperature, and humidity. A single normal air sample does not guarantee the absence of hidden mold, and a single elevated sample does not necessarily confirm a catastrophic problem. A professional mold inspection typically includes multiple sample locations, visual assessment, moisture mapping, and correlation of all findings before drawing conclusions. Context matters as much as the numbers.
Confusing Non-Cultured and Cultured Results
Non-cultured (direct examination) results and cultured results use different units and cannot be directly compared. A non-cultured spore trap result of 2,000 Aspergillus/Penicillium spores/m3 includes both viable and non-viable spores. A cultured result of 200 CFU/m3 for Aspergillus niger represents only viable, living organisms. Comparing these numbers side by side leads to incorrect conclusions. Additionally, certain species identified through culture may not appear on non-cultured reports because they require growth on media for accurate identification, while some hyphal fragments and certain spore types counted by direct examination may not grow in culture.
Action Levels and Remediation Thresholds
While no government agency has set legally binding mold exposure limits, several professional organizations and experienced industrial hygienists have published interpretation guidelines that serve as practical action levels. Understanding these guidelines helps determine whether results warrant remediation, monitoring, or no action.
AIHA and Professional Consensus Guidelines
The American Industrial Hygiene Association (AIHA) publishes the “Recognition, Evaluation, and Control of Indoor Mold” reference document used by many industrial hygienists. The general professional consensus for air sampling interpretation includes the following action level framework, though individual assessors may adjust based on building-specific factors:
| Finding | Action Level | Recommended Response |
|---|---|---|
| All indoor species and counts below outdoor levels | Normal | No action required. Building performing as expected. |
| Indoor total count slightly above outdoor; common species only | Watch | Retest in 30 days. Check for obvious moisture issues. Improve ventilation. |
| Single indoor species 2-5x outdoor level | Investigate | Targeted moisture assessment in affected area. Identify and address source. |
| Multiple indoor species elevated above outdoor; or any water-damage indicator present indoors only | Action Required | Professional mold inspection with moisture mapping. Likely remediation needed. |
| Stachybotrys or Chaetomium detected indoors at any level (absent outdoors) | Immediate Action | Professional remediation assessment. Active water damage almost certain. |
Surface Sample Interpretation
Surface samples are more straightforward to interpret than air samples because there is no outdoor comparison required. If mold is growing on an indoor surface, that is inherently abnormal regardless of species or quantity. Surface sample results confirm what species is growing and help guide the remediation approach. A surface sample positive for Stachybotrys on drywall, for example, confirms that the affected material must be physically removed (not merely cleaned) because Stachybotrys penetrates into the paper facing of drywall and cannot be effectively surface-cleaned. The semi-quantitative scale used for tape lift analysis (rare, low, medium, high) corresponds roughly to the density of growth observed. “High” density typically indicates mature, actively sporulating colonies, while “rare” may indicate early-stage growth or settled spores from a nearby source.
What to Do After Reviewing Your Results
Once the mold test results have been interpreted, the appropriate next step depends entirely on what the data shows. Having a clear decision tree prevents both over-reaction and under-reaction.
Results Show Normal Conditions
If all indoor species are at or below outdoor concentrations and no water-damage indicator species appear indoors only, the building is performing normally from a mold perspective. No remediation is needed. If the test was triggered by health concerns, the results suggest that the current indoor mold profile is not likely the cause, and other environmental factors (VOCs, dust, allergens, HVAC issues) should be investigated. Continue routine moisture monitoring and maintain indoor relative humidity below 50% as a preventive measure. Consider retesting seasonally if the building has a history of moisture issues, as conditions change with weather patterns.
Results Show Elevated Levels
When one or more indoor species are elevated above outdoor levels, the priority is identifying the moisture source driving the indoor mold growth. Elevated Aspergillus/Penicillium often points to condensation, HVAC issues, or moderate dampness in walls or ceilings. Start with a thorough visual inspection of the areas where the elevated sample was collected. Use a moisture meter to check wall cavities, flooring, and ceiling materials. Look for water stains, peeling paint, musty odors, and visible growth in concealed areas (behind furniture, inside closets, under sinks). Address the moisture source first, then consider whether the mold-affected area is small enough for DIY cleaning (generally less than 10 square feet per the EPA’s guidelines) or large enough to require professional remediation. A follow-up mold test after remediation confirms that the source was successfully addressed.
Results Show Water-Damage Indicators
Detection of Stachybotrys, Chaetomium, Trichoderma, or other water-damage indicator species indoors (when absent outdoors) represents the most urgent finding on a mold report. These species require sustained, heavy moisture to establish colonies, meaning the building has or recently had a significant water intrusion event. Professional remediation following IICRC S520 protocols is strongly recommended. The remediation scope should include: identifying and repairing the water source, establishing containment and negative air pressure in the affected area, removing all mold-contaminated porous materials (drywall, insulation, carpet padding), HEPA-vacuuming all surfaces, applying antimicrobial treatment to structural wood if salvageable, and conducting post-remediation verification (PRV) testing to confirm successful cleanup. Clearance testing after remediation should show indoor levels at or below pre-established baseline levels with no detection of the water-damage indicator species that triggered the original assessment.
How Lab Quality Affects Your Results
Not all mold testing laboratories deliver the same quality of analysis. The reliability of mold test results depends heavily on the laboratory’s accreditation status, analyst qualifications, and quality control procedures. Choosing a reputable lab is as important as collecting the sample correctly.
AIHA EMLAP Accreditation
The AIHA Environmental Microbiology Laboratory Accreditation Program (EMLAP) is the gold standard for mold analysis laboratories. EMLAP-accredited labs undergo regular proficiency testing, on-site audits, and must demonstrate competency in spore identification and counting accuracy. Labs like EMSL Analytical, EMLab P&K (now part of Eurofins), and Pro-Lab Diagnostics maintain EMLAP accreditation. Results from non-accredited laboratories carry significantly less reliability. When reviewing a mold report, check the footer or header for an AIHA-EMLAP accreditation number. If no accreditation is listed, the results should be treated with appropriate skepticism.
Chain of Custody and Sample Integrity
Reliable mold test results depend on proper sample handling from collection through analysis. The chain of custody form documents who collected the sample, when and where it was collected, how it was transported, and when the lab received it. Spore trap cassettes that are exposed to excessive heat, moisture, or physical shock during transport may produce inaccurate results. Most laboratories require samples to arrive within 7 days of collection, though sooner is better. Samples that arrive with broken seals, moisture contamination, or without a completed chain of custody form may be rejected or flagged with qualifying notes on the report. These qualifying notes are important to read because they can indicate that the results may not fully represent actual conditions.
Seasonal and Regional Factors That Affect Mold Test Results
Mold spore concentrations in outdoor air vary dramatically by season and geographic region, which directly affects how indoor results are interpreted. Understanding these patterns prevents misinterpretation of results that are actually within normal seasonal ranges.
In temperate climates across most of the United States, outdoor mold spore counts peak in late summer and early fall (July through October) when temperature and humidity are highest and plant material is decaying. During these months, outdoor total spore counts commonly exceed 10,000 to 50,000 spores/m3. In winter, particularly in northern regions, outdoor counts may drop below 500 spores/m3 because cold temperatures suppress mold growth and snow covers soil sources. This means an indoor count of 3,000 spores/m3 in January, when outdoor levels are at 200 spores/m3, tells a very different story than the same 3,000 spores/m3 in August when outdoor levels are at 25,000 spores/m3. The January reading suggests a significant indoor source, while the August reading represents normal filtration of abundant outdoor spores.
Regional factors also play a role. Gulf Coast states with persistent high humidity often show higher baseline indoor and outdoor mold levels than arid regions like the Southwest. Coastal areas, agricultural zones, and heavily wooded regions each have distinct spore profiles. An experienced mold inspector or industrial hygienist familiar with local conditions can provide more nuanced interpretation than a homeowner comparing raw numbers to generic internet guidelines.
Frequently Asked Questions
What is a normal mold spore count indoors?
There is no single “normal” number for indoor mold spore counts because acceptable levels vary based on outdoor conditions, season, and geographic location. The standard assessment method compares indoor counts to the outdoor control sample collected at the same time. Indoor total spore counts should generally be equal to or lower than outdoor counts, and the species found indoors should mirror the outdoor profile. In summer, indoor counts of 1,000 to 5,000 spores/m3 can be completely normal if outdoor counts are 10,000 to 30,000 spores/m3. In winter with outdoor counts at 300 spores/m3, indoor counts above 500 may warrant investigation.
What does it mean if Stachybotrys appears on my mold test?
Stachybotrys chartarum detection indoors, when it is not present in the outdoor control sample, is one of the most significant findings possible on a mold air quality report. This species requires chronically wet cellulose materials to grow, meaning its presence confirms sustained water damage somewhere in the building. Because Stachybotrys spores are heavy and do not easily become airborne, even low concentrations (50 to 200 spores/m3) indicate active growth relatively close to the sampling location. Professional remediation following IICRC S520 protocols is recommended whenever Stachybotrys is detected indoors.
Can a DIY mold test kit give accurate results?
DIY mold test kits vary widely in quality and methodology. Gravity settle plate kits (where a petri dish is left open on a surface) are generally considered unreliable by the industrial hygiene community because they do not sample a known volume of air, making concentration calculations impossible. Cassette-based DIY air sampling kits that include a calibrated pump and send samples to an AIHA-accredited laboratory for analysis can produce results comparable to those collected by professionals, provided the homeowner follows the sampling instructions precisely. The key quality indicators for a DIY kit are: does it include a calibrated pump, does it require an outdoor control sample, and does it use an AIHA-accredited lab for analysis. Kits that meet all three criteria produce useful data.
What is the difference between spores/m3 and CFU/m3?
Spores per cubic meter (spores/m3) is the unit used for non-cultured spore trap analysis, where all visible spores (both living and dead) are counted under a microscope. Colony-forming units per cubic meter (CFU/m3) is used for cultured analysis, where only living organisms that successfully grow on nutrient media are counted. Spore trap counts are typically higher than culture counts for the same air because spore traps capture dead spores, fragments, and non-viable material. The two measurement systems cannot be directly compared. Both provide useful information: spore traps show total exposure (including dead spores that can still cause allergic reactions), while cultures identify exactly which species are viable and actively growing.
How long does it take to get mold test results back?
Standard turnaround time for non-cultured spore trap analysis is 1 to 3 business days after the laboratory receives the samples. Rush service (same-day or next-day) is available from most major labs for an additional fee. Cultured analysis requires 7 to 14 days because the organisms must grow on media before identification. ERMI analysis via MSQPCR typically takes 5 to 10 business days. Some laboratories offer preliminary results via email or online portals within 24 hours for spore trap samples, with the formal report following 1 to 2 days later. When requesting testing, factor in shipping time from the collection site to the laboratory, which typically adds 1 to 3 days depending on the shipping method selected.
Should mold test results be interpreted by a professional?
For straightforward results where all indoor levels are clearly below outdoor levels and no water-damage indicator species appear, a homeowner can reasonably interpret the data using the guidelines described in this article. For results that show borderline elevations, unusual species distributions, or any detection of water-damage indicators, professional interpretation by a certified industrial hygienist (CIH) or a Council-certified Microbial Consultant (CMC) is strongly recommended. These professionals can correlate the lab data with visual observations, moisture readings, building history, and occupant health complaints to provide a comprehensive assessment that goes beyond what the numbers alone can reveal.
Do I need to test for mold if I can already see it?
The EPA states that if visible mold is present, testing is generally not required before proceeding with remediation. Visible mold growth confirms contamination regardless of species or spore count. However, testing can still be valuable in certain situations: when occupants want species identification for health-related concerns (particularly to confirm or rule out Stachybotrys), when there is a dispute between homeowner and landlord or homeowner and insurance company, when the full extent of contamination is unclear and hidden mold is suspected beyond the visible area, or when post-remediation verification is needed to confirm successful cleanup. Testing is most valuable as a diagnostic tool for hidden mold and as verification after remediation, not as a prerequisite for cleaning up visible growth.
Learning how to read mold test results accurately transforms a confusing lab document into a clear action plan. The fundamental principles to remember are: always compare indoor results to the outdoor control sample, evaluate species individually rather than relying solely on total spore counts, pay special attention to water-damage indicator species like Stachybotrys and Chaetomium, and understand that no single test provides a complete picture of building conditions. Mold testing is one tool in a broader assessment process that includes visual inspection, moisture measurement, and professional judgment. When results indicate a problem, acting promptly to identify and eliminate the moisture source, followed by appropriate remediation, protects both the building and its occupants.
Frequently Asked Questions
What do the different mold types listed on my test results mean?
Mold test results often list various genera like Cladosporium, Aspergillus/Penicillium, and Stachybotrys. These indicate different types of mold spores present, some of which are common outdoor molds while others are more indicative of indoor water damage.
How do I interpret the ‘counts’ or ‘concentrations’ on my mold test report?
Counts or concentrations represent the number of mold spores found per unit of air or surface area. Higher numbers, especially for specific indoor molds, can suggest an active mold problem, particularly when compared to an outdoor control sample.
What is a ‘normal’ or ‘acceptable’ level of mold according to test results?
There isn’t a universally accepted ‘normal’ level, as it varies by mold type and location. However, indoor mold spore counts should generally be lower than or similar to outdoor levels for common outdoor molds, and specific water-indicator molds should be absent or very low indoors.

Why is an ‘outdoor control sample’ important when reading my indoor mold test results?
An outdoor control sample provides a baseline for naturally occurring mold spores in your environment. Comparing indoor counts to outdoor levels helps determine if indoor mold concentrations are elevated due to an indoor source rather than just ambient outdoor spores.
My test results show ‘non-viable’ mold spores. What does this mean for remediation?
Non-viable mold spores are dead but can still cause allergic reactions and health issues. Therefore, even if spores are non-viable, their presence in high concentrations still indicates a past or present mold problem that requires professional cleaning and remediation.

The report mentions ‘hyphal fragments.’ What are these and are they significant?
Hyphal fragments are pieces of the mold’s root structure, called hyphae. Their presence in air samples is significant because it indicates an active mold colony is growing and potentially breaking apart, releasing these fragments into the air.
These statements have not been evaluated by the Food and Drug Administration. This information is not intended to diagnose, treat, cure, or prevent any disease. Content is for informational purposes only and is not medical advice; consult a qualified healthcare provider before starting any supplement. As an Amazon Associate we earn from qualifying purchases.